Real relief: What Illinoisans looking for property tax reform can learn from Virginia
By Orphe Divounguy, Bryce Hill, Joe Tabor
Illinoisans pay some of the highest property taxes in the nation. And politicians on both sides of the aisle recognize that property tax relief should be a top priority.
Unfortunately, while most of these property tax revenues go to Illinois public schools – and Illinois spends more per student than the national average – the state’s educational outcomes lag the rest of the nation. Illinoisans are not getting the bang for their buck that other states are seeing.
To where can Illinois lawmakers look for solutions?
When looking at tax policy, there is an unsung example of a state that can provide essential services without overburdening taxpayers: Virginia. Virginia has adopted policies that have protected residents from high taxation, delivered higher quality schools and yielded healthier economic growth than Illinois.
Policymakers interested in serious property tax relief should take note.
The Land of Lincoln vs. the Old Dominion
Illinois and Virginia have a similar demographic makeup, with Illinois enjoying a larger population than Virginia. But Virginia lawmakers have chosen a far different approach when it comes to collecting and distributing tax dollars.
Comparison: Taxing and spending
Virginia’s median effective property tax rate was 0.8 percent in 2013, according to the Lincoln Institute of Land Policy,1 while Illinois residents saw a median effective property tax rate of 2.3 percent.
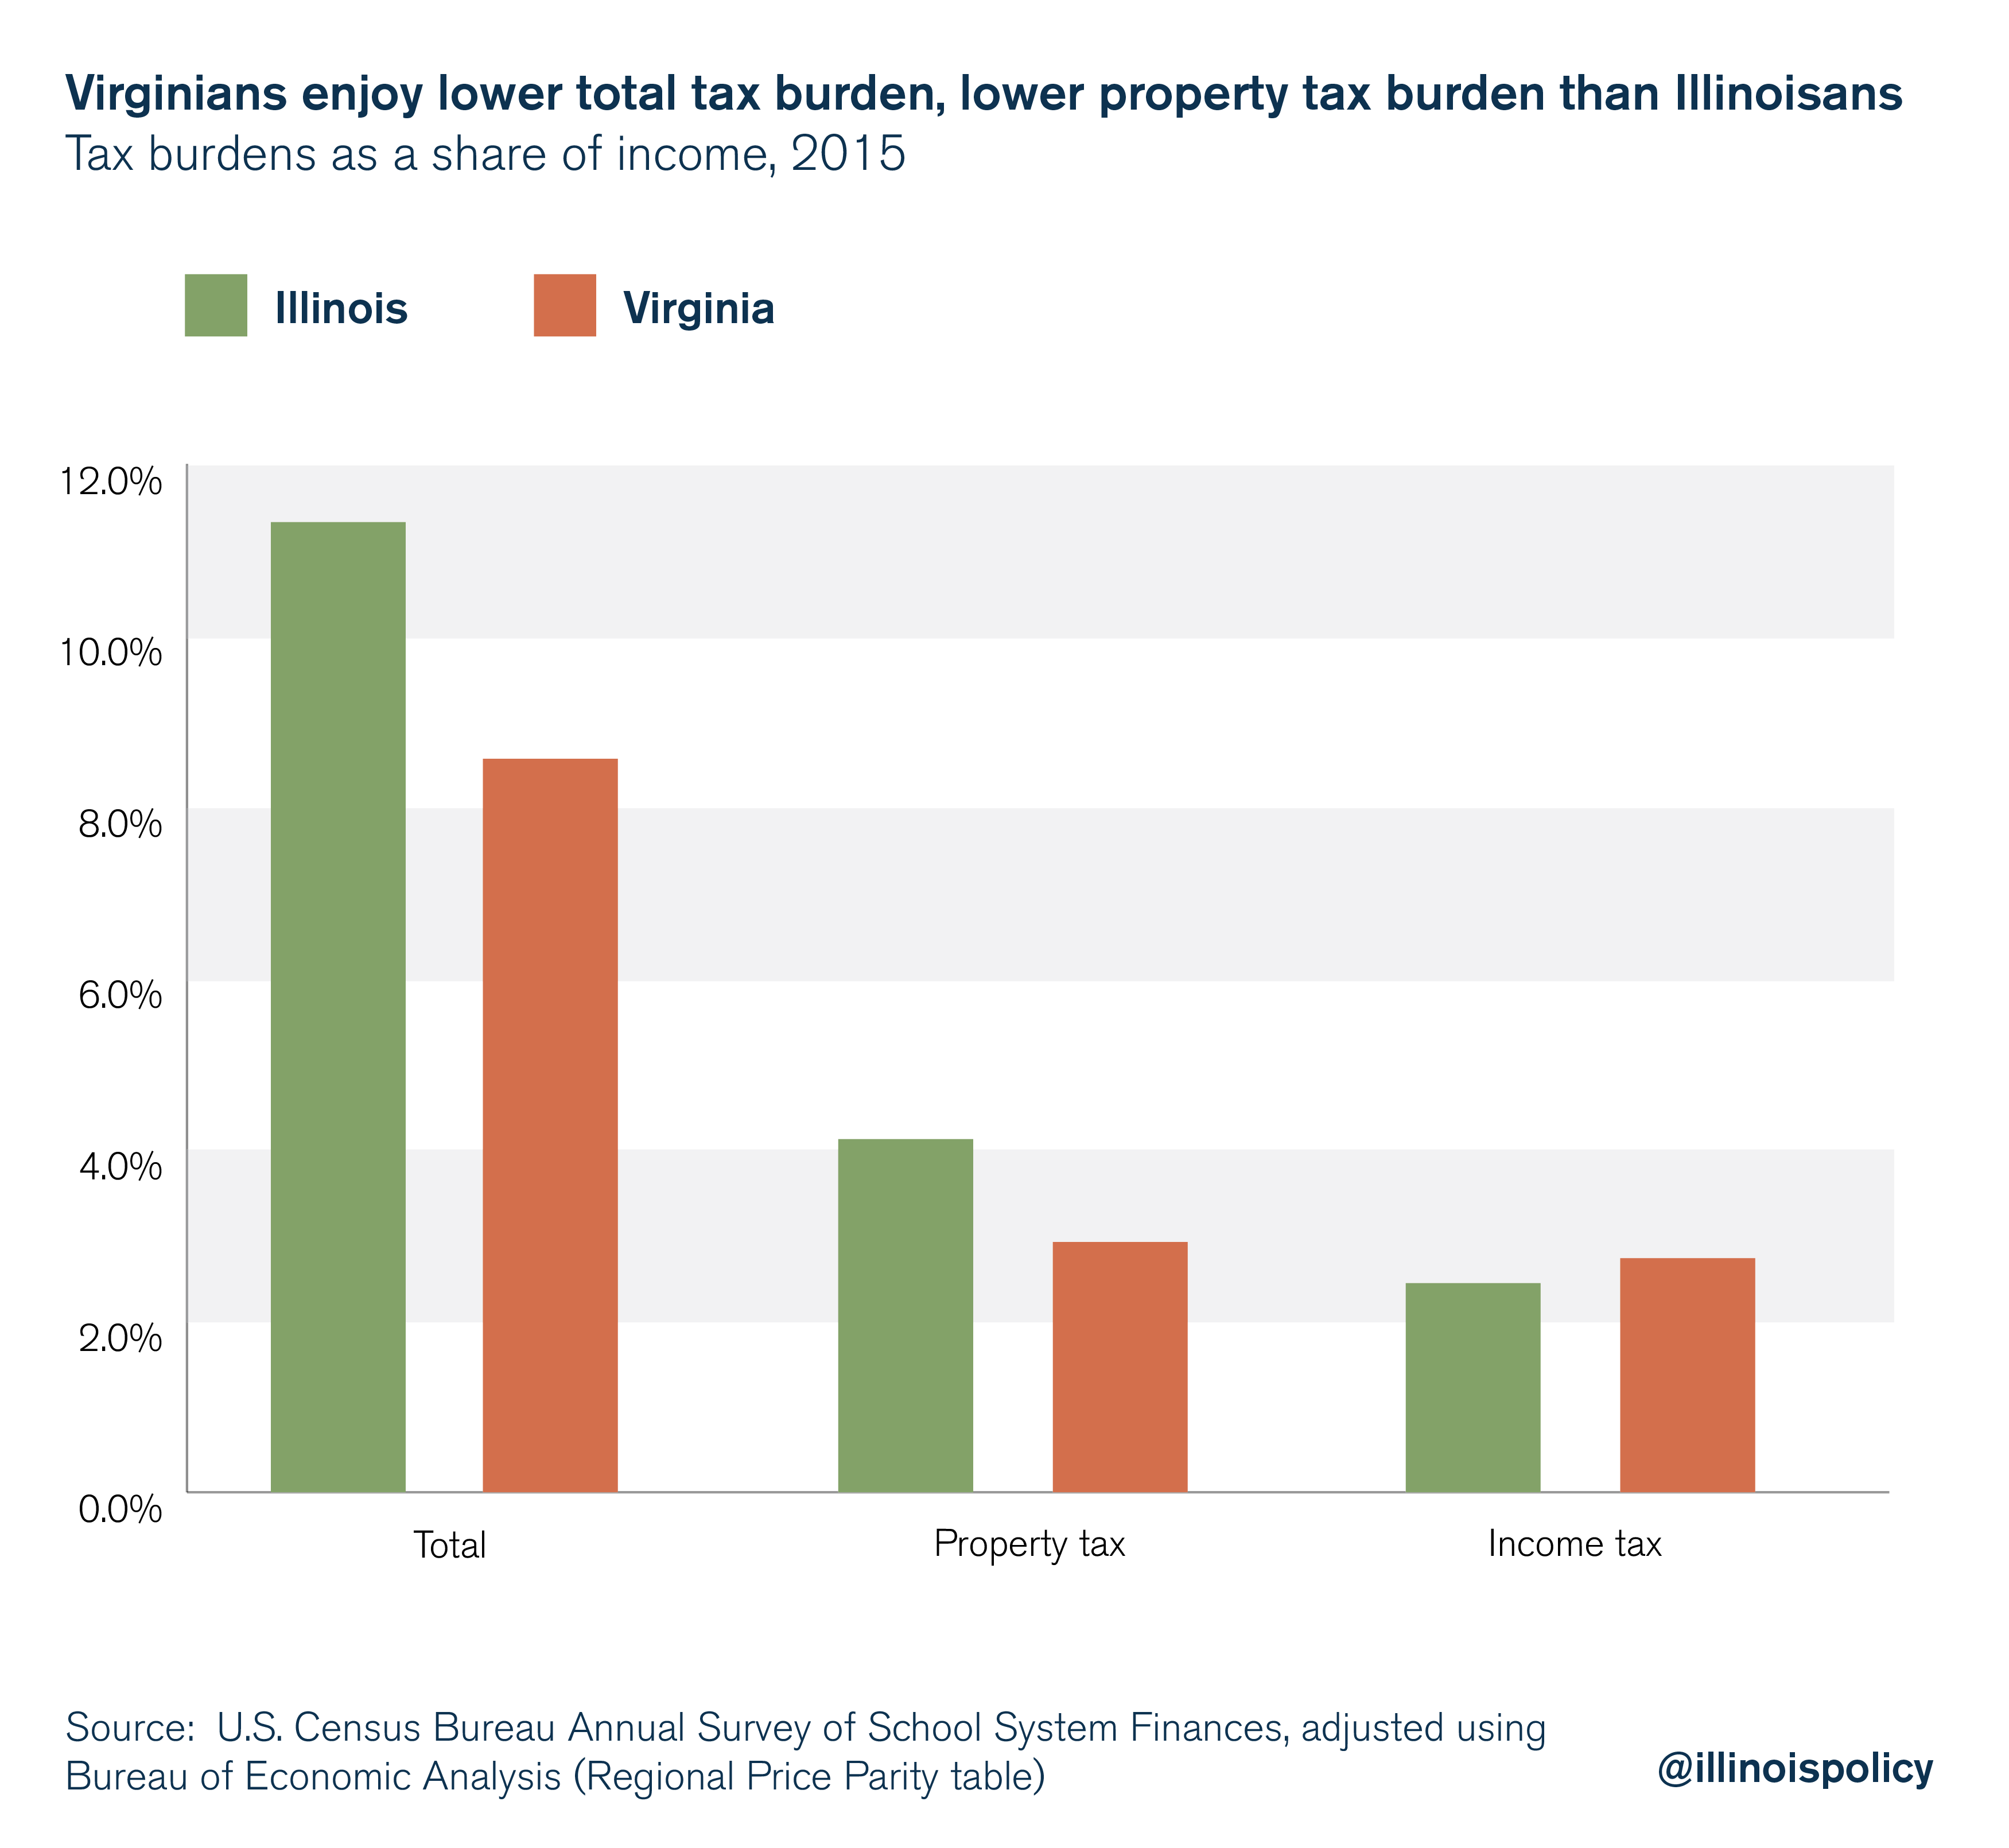
Despite technically having a “progressive” income tax, Virginia’s top marginal income tax rate is 5.75 percent, applying to all those making over $17,000 annually.2 This basically amounts to a “flat” income tax that was 11.9 percent higher than Illinois’ in 2015, when the effective income tax rate was 2.44 percent in Illinois and 2.73 percent in Virginia.3,4
Despite the slightly higher income tax, Virginians enjoy a much lower total tax burden. Virginians’ total tax burden amounts to 8.6 percent of their personal income while Illinoisans see a total tax burden of 11.3 percent, according to U.S. Census data – more than 30 percent higher than Virginians.5

Adjusted for cost of living, Virginia’s state and local governments spent $9,066 per person in 2015. Illinois’ state and local governments spent $11,773 per person.6
In comparing where those dollars flow, it’s useful to look at how Virginia and Illinois fund their schools.
Virginia spent 20 percent less on K-12 education per student than Illinois in 2015, after adjusting for cost of living. Virginia spent $10,963 per student, compared with $13,797 per student in Illinois.7
While Illinois relies more on property taxes to fund public schools than Virginia, as opposed to state funding, this proportion is irrelevant when comparing overall taxing and spending. Virginians see fewer dollars flow toward education overall and experience a lower total tax burden – and still see better educational outcomes than Illinois, as this report will show.
County and municipal governments raise the money for Virginia public schools in their jurisdiction, rather than the school districts themselves. Virginia does not suffer from the dizzying overlap of thousands of local taxing bodies that Illinoisans experience. Rather, county and municipal governments raise a single levy, which is then distributed to schools and other public services.
Virginia spends more efficiently by having a much more consolidated school district system, with 130 public school districts compared with Illinois’ more than 850 public school districts.8 The average public school district in Virginia serves more than twice the number of students compared with Illinois, despite average enrollment per school being very similar.
Virginia spends $1,149 less per student on non-instruction costs and $2,834 less per student in total than Illinois, when adjusted for the cost of living in each state.9
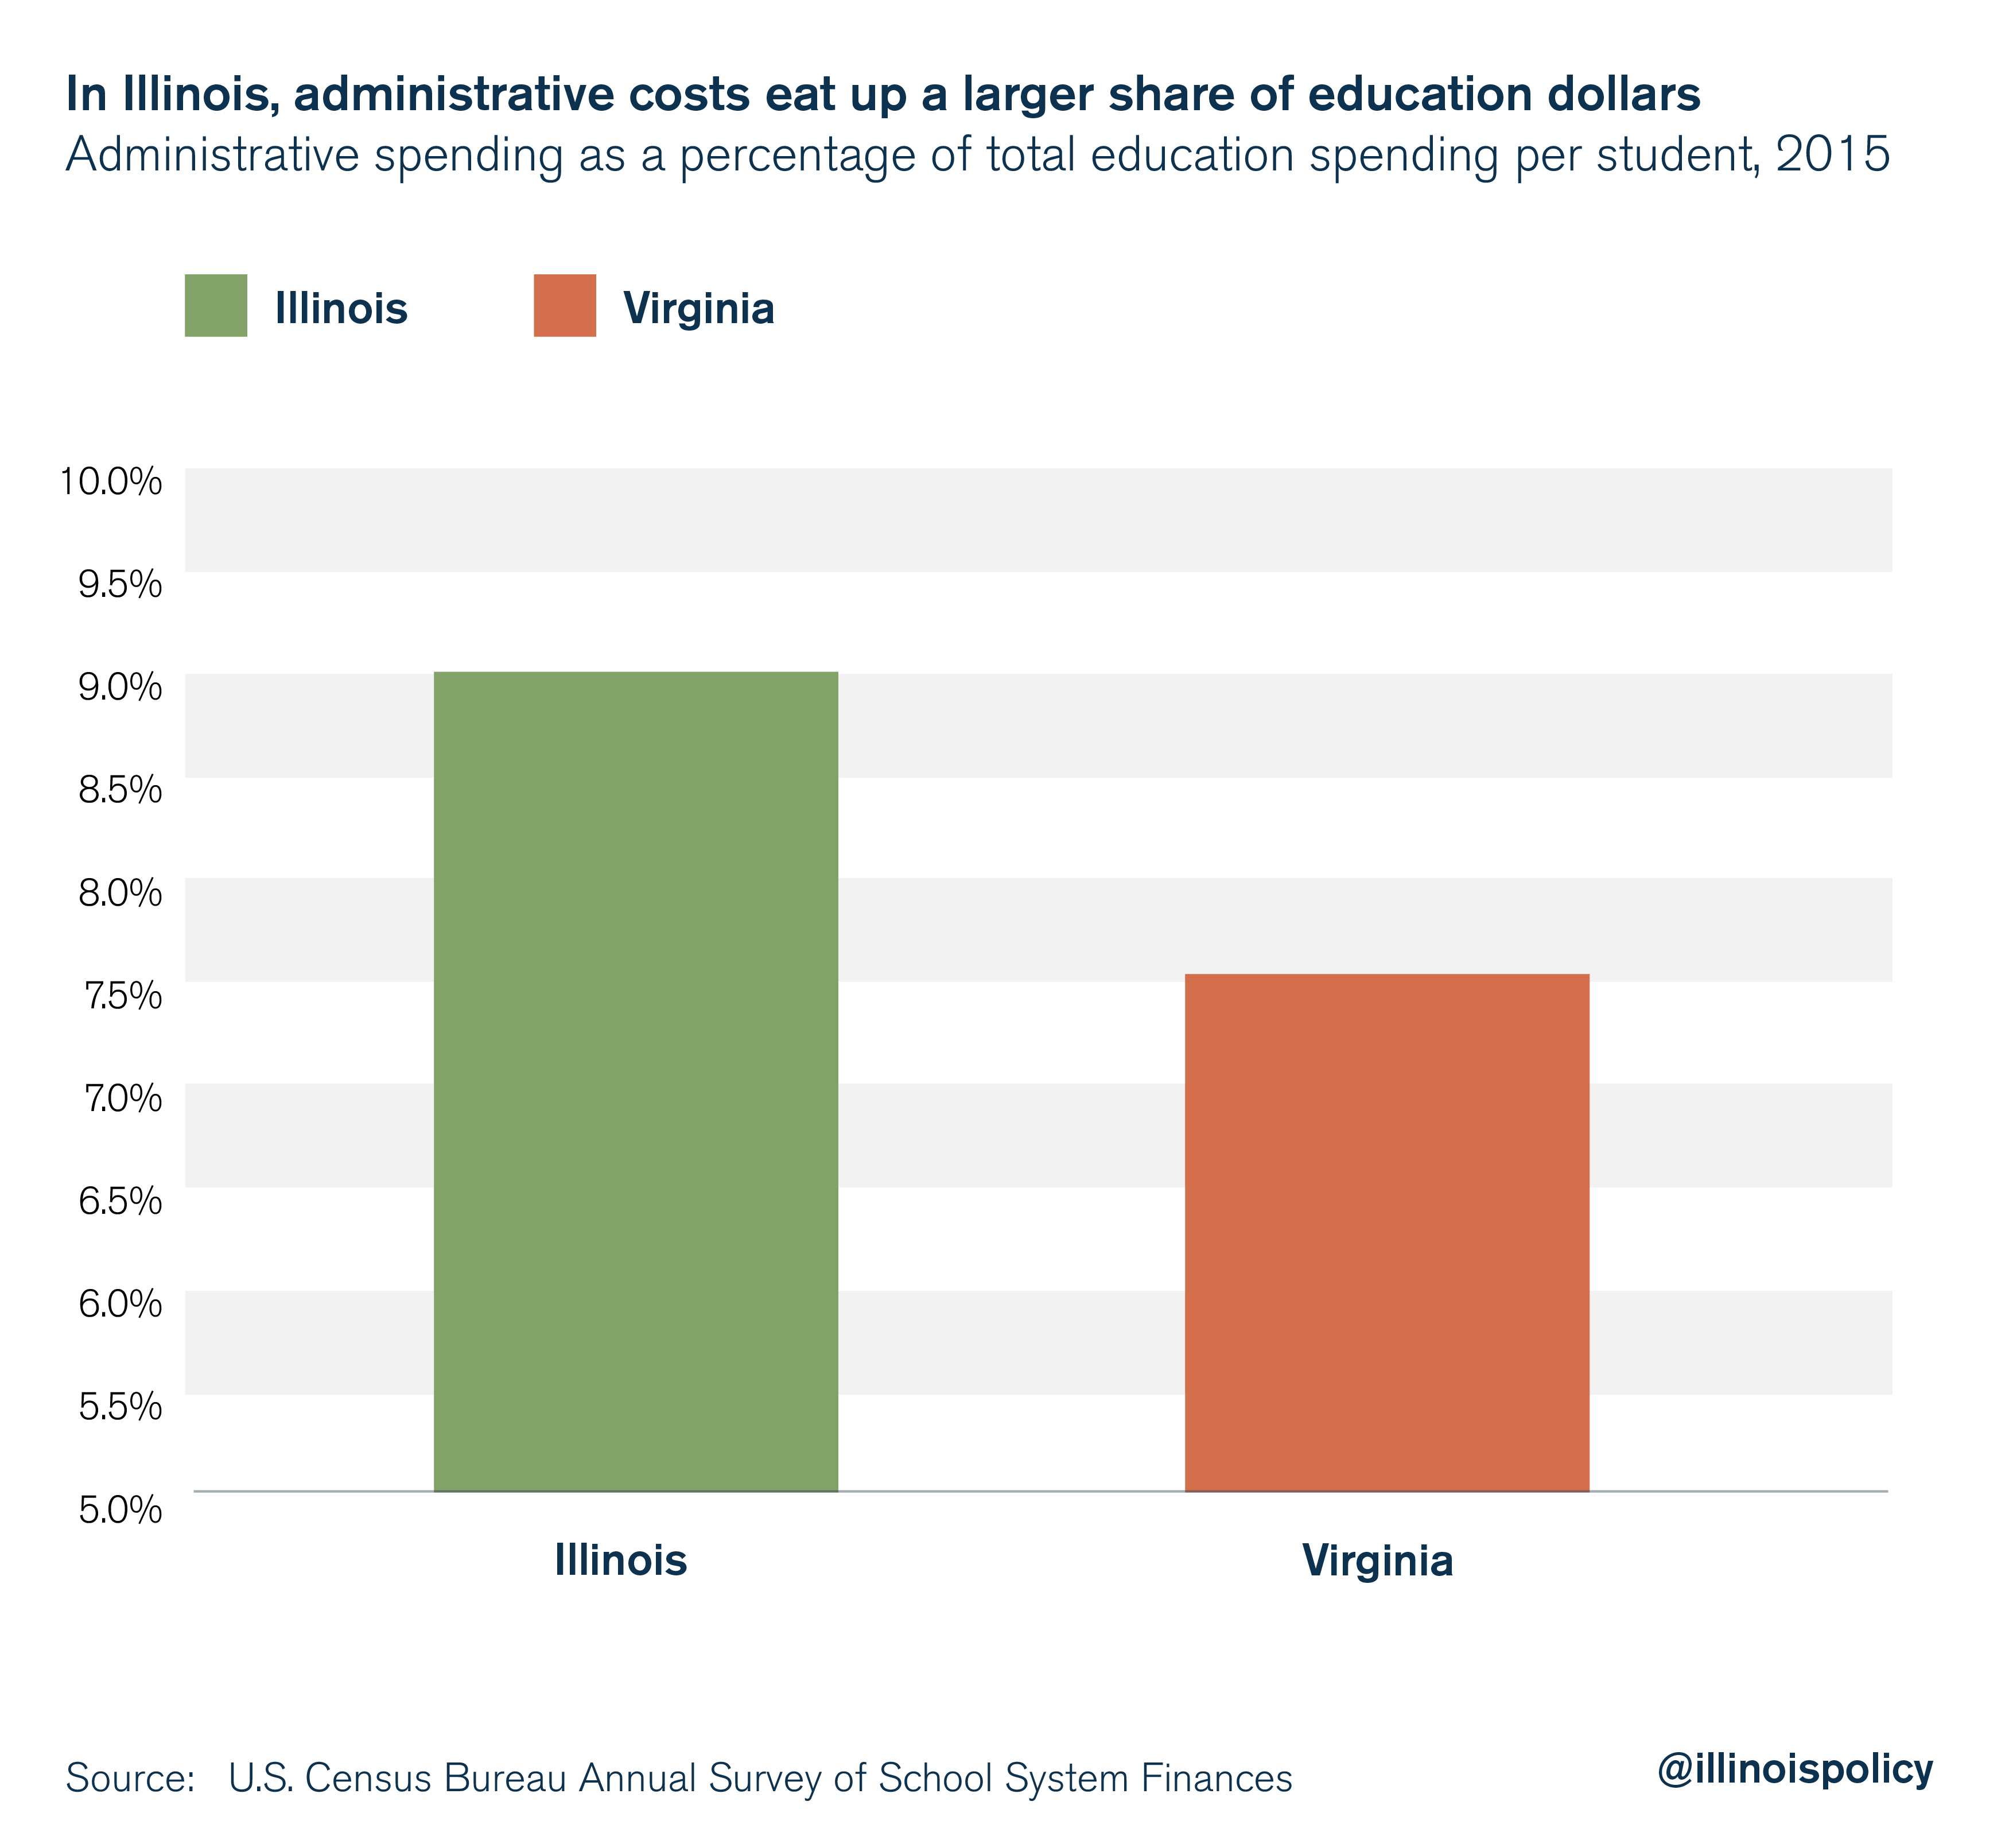
In Illinois, administrators take a larger share of resources away from the classroom. Just under 9 percent of education spending per student flows to administrative costs in Illinois. That’s a 20 percent larger share than Virginia, where just over 7.5 percent flows to administrators.

Outcomes: Education
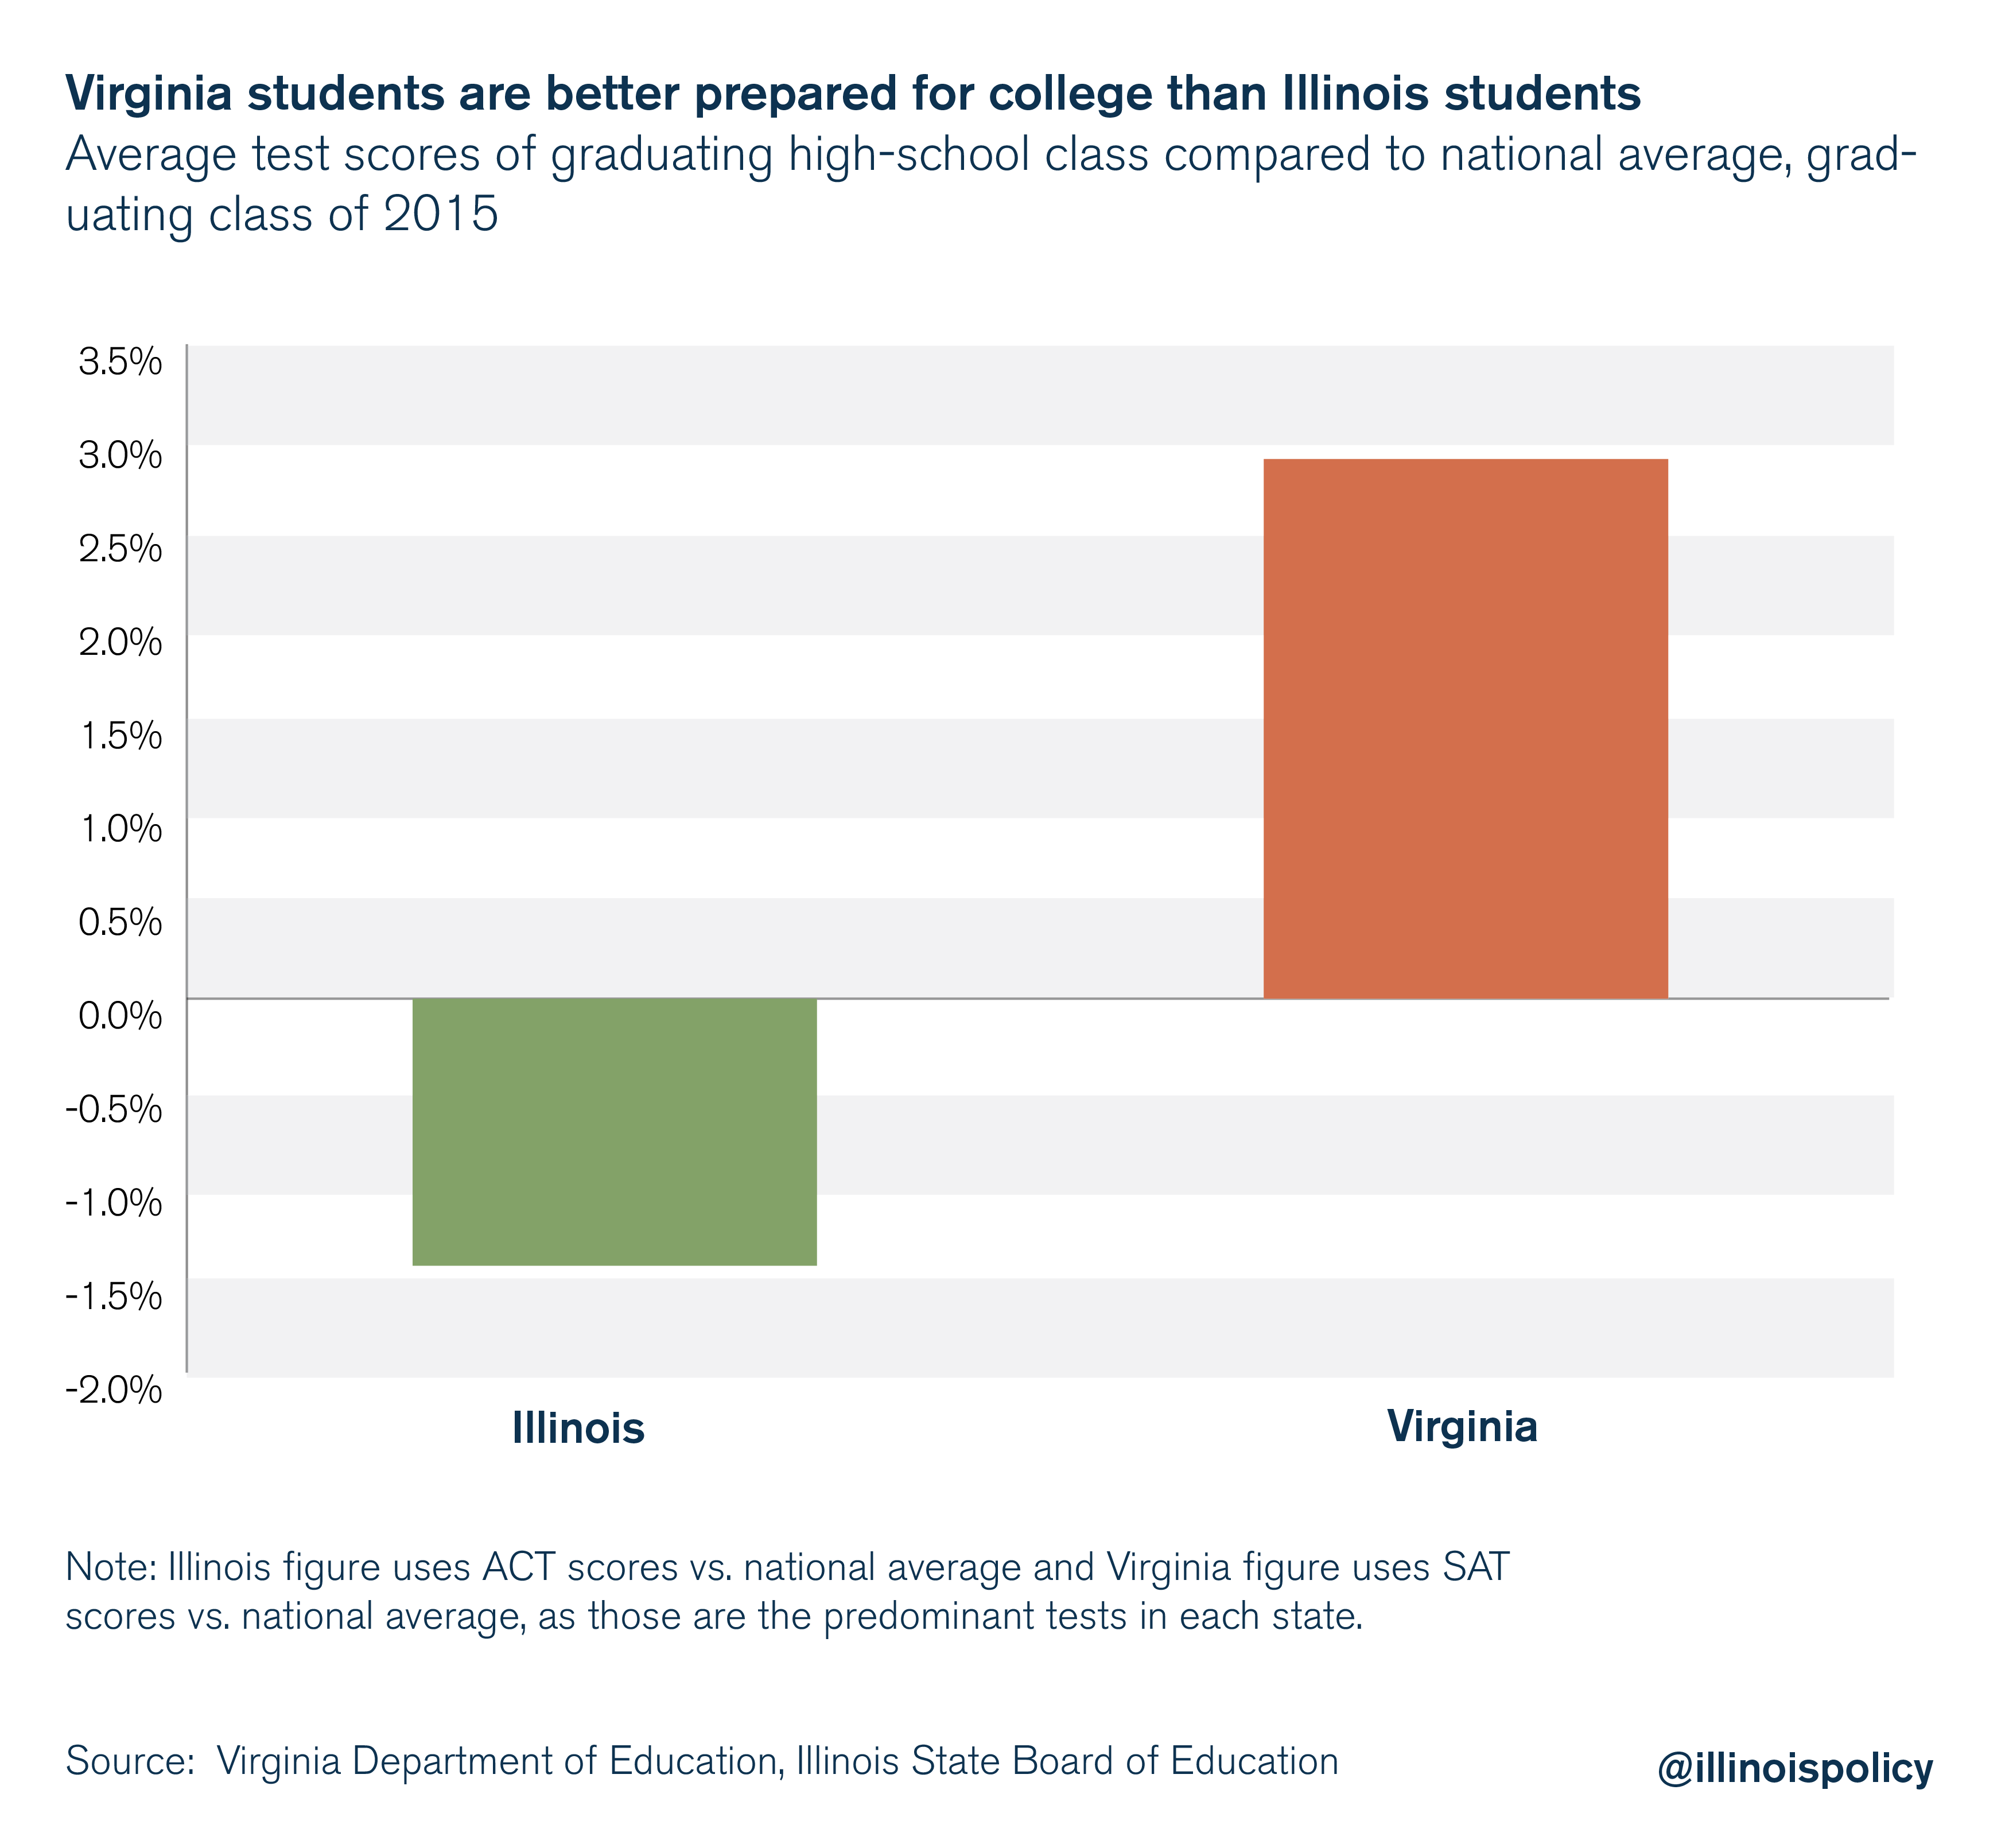
Despite more modest spending and a lower burden of taxation, Virginia’s public school system has a higher four-year high school graduation rate and better prepares its students for college than Illinois’.10
ACT scores in Illinois (the dominant standardized college admission test in the state) were 1.4 percent below the national average, while SAT scores in Virginia (the dominant test in that state) were 2.9 percent above the national average.

Virginia’s outcomes show Illinois could reprioritize its spending away from administrative costs while not sacrificing the quality of education.
Outcomes: The state economy
On economic and demographic measures, Virginia is similar to Illinois in many ways.
Non-farm personal income per worker is nearly identical when adjusted for the cost of living.11 Virginia also saw slight net outmigration of taxpayers to other states in 2015, albeit much smaller than that of Illinois, losing 3,155 tax filers (0.04 percent) on net compared with Illinois’ net loss of 25,302 tax filers (0.2 percent).12
However, there are also many ways in which Virginia is different from Illinois.
From 2000 to 2016, Virginia’s population growth far surpassed that of Illinois, growing 18.4 percent while Illinois’ population grew by a meager 3 percent.13
Meanwhile, Illinois’ employment fell by 0.04 percent while Virginia’s increased 11.2 percent over the same time.14 Non-farm personal income per worker also grew 18 percent faster in Virginia than in Illinois from 2000 to 2016.15
Also during this time period, home values grew by an average of 4.1 percent annually in Virginia compared with 1.9 percent annually in Illinois, while the national average was 3.1 percent.16 Virginia’s median home value was actually 4.4 percent lower than Illinois’ in 2000. But after 15 years of faster appreciation, the median home value in Virginia is now 32 percent higher than in Illinois.
While it’s true that the federal government wields great influence over the Virginia economy – nearly 10 percent of economic activity – federal spending alone cannot account for all of the disparities between Virginia and Illinois.17
In the private sector, Virginia’s employment, wages and salaries, and output have all routinely outpaced Illinois’. The private sector in Virginia grew by 3.8 percent annually from 2000 to 2016, while the private sector in Illinois grew by 3.1 percent annually.18
Federal spending cannot account for all the observed differences between the two states. Virginia is outperforming Illinois economically.
Fixing Illinois
The Virginia model offers a path to significant property tax relief for Illinois families.
If Illinois governments spent as much as Virginia in per capita terms, not including any changes to Illinois’ broken pension system, Illinois state government would have saved an estimated $6.5 billion in 2015. Local governments in Illinois would have saved even more: $13.8 billion.
As an example, in DuPage County the effective property tax rate was 2.42 percent in 2015.19 Adopting Virginia’s model would have resulted in savings estimated at $1.5 billion, which, if fully passed down to homeowners, would translate to an effective property tax rate of 0.62 percent at 2015 DuPage County housing prices.
Illinois would have to adopt significant policy reforms to realize the full benefits of adopting the Virginia model of reduced overall taxation, more reasonable spending priorities and improved outcomes. There are five primary hurdles lawmakers will have to jump in order to realize these savings.
Areas in need of reform
1) The power of government worker unions
The collective bargaining regimes of Illinois and Virginia vary greatly. Virginia passed legislation in 1993 expressly prohibiting public sector collective bargaining across the state.20 While government workers can form unions, those unions do not have power to negotiate with the state over wages, hours or other conditions of employment.21 Further, state law explicitly prohibits strikes by government workers.22 and grants right to work in both the public and private sectors.23
The opposite is true in Illinois. Under Illinois law, government workers can organize and form unions for negotiating employment contracts and other purposes. This includes a variety of state and local workers, including teachers.
Government worker unions in Illinois can negotiate over just about anything – from wages to sick days to school start times. What’s more, there are no limits to the duration of the contracts negotiated. Contracts can lock taxpayers into paying for wage increases or benefits for 10 years or more.24 The power government worker unions wield over taxpayers has burdened communities with costs they can’t afford, and has contributed to skyrocketing property tax bills. Illinois can look to surrounding states for sensible ways to level the playing field between government worker unions and taxpayers.
2) Prevailing wage laws
Illinois is home to a prevailing wage law that inflates the cost of public construction projects. Virginia does not have a prevailing wage law. The presence of a prevailing wage law has pushed up compensation costs for public construction projects by an average of 37 percent in Illinois. This arbitrary law ensures taxpayer dollars are not spent as efficiently as possible, reduces construction employment, and exacerbates the wage gap between union and non-union construction workers.25
3) Pension costs
Virginia taxpayers contribute nowhere near what Illinois taxpayers contribute toward local pensions. According to the 2015 Annual Survey of Public Pensions, Illinois local government pension contributions were 8.9 percent of local government expenditures, whereas Virginia local government contributions were just 2.3 percent of expenditures.26 Total state and local pension contributions were 7 percent of total expenditures in Illinois and 4 percent in Virginia.27
These local government pension payments come largely from property taxes, and due to barriers in the Illinois Constitution may not be reduced anytime soon. Illinois will have to discount any savings in pension costs from adopting the Virginia model. Even so, the remainder of savings will be significant.
4) Unfunded mandates
Unfunded mandates imposed on local governments by the state contribute to the rising cost of local government on Illinois taxpayers. Although difficult to quantify exact costs, state-imposed unfunded mandates have been estimated to cost Illinois local governments hundreds of millions of dollars each year.
From 1982 to 2014, Illinois added 266 unfunded mandates to municipal governments. As the mandates increased, so did expenditures.28 Local governments cited pensions, the prevailing wage and workers’ compensation costs as the most burdensome, but the state also imposes mandates on local entities to provide for insurance, training, education, procurement rules, and collective bargaining and arbitration. While pensions cannot be touched under current Illinois jurisprudence, these unfunded mandates should be eliminated wherever possible.
5) Too many local governments
Illinois’ system of overlapping units of government creates bureaucratic inefficiencies and waste that Virginia avoids.
Through a much more consolidated system, governments in Virginia service nearly 8 times as many people as governments in Illinois. If Illinois were to adopt a consolidated system similar to that of Virginia, the state would reduce the number of government units from nearly 7,000 to just under 800.
A path forward
Virginia appears to offer a potential path forward for Illinois. Illinois should embrace the methods that have created a more prosperous economy, a more robust labor market and better educational outcomes for children in Virginia.
If lawmakers made this a priority, Illinois could offer residents a better life and relief from their egregious tax burdens.
Tackling collective bargaining reform, eliminating the prevailing wage, freeing local governments from the burden of unfunded mandates and reducing Illinois’ 7,000 units of overlapping governments would be direct steps toward making this a reality.
However, there are additional steps that could get Illinois to the finish line in establishing an effective property tax rate that is under 1 percent.
It is important to note that any policies that improve home values – often a family’s largest investment – can also help to reduce the effective property tax rates. Improvements in education by prioritizing students over administrators through consolidation could yield better educational outcomes.
Economists agree that better educational outcomes increase home values. Fack and Grenet (2010) find that an increase in public school performance of one standard deviation raises housing prices by up to 2.4 percent.29 Black (1999) finds that a 5 percent increase in test scores increases the amount parents are willing to pay for homes by 2.1 percent.30
Conclusion
If Illinois adopted Virginia’s spending habits along with policies that can reduce costs and raise home values, the Prairie State could vastly reduce the property tax burden that Illinois homeowners currently face.
By pursuing proven reforms, Illinois could be well on its way to seeing real and lasting property tax relief.
Endnotes
- “State-By-State at a Glance Property Tax Visualization Tool,” Lincoln Institute for Land Policy.
- “Individual Income Tax,” Virginia Department of Taxation.
- The effective income tax rate for Illinois is likely underreported, as the 5 percent income tax rate was reduced to 3.75 percent six months into fiscal year 2015.
- Illinois Policy Institute calculations using Bureau of Economic Analysis Regional Data for Personal Income and U.S. Census Bureau Survey of State and Local Government Finances data.
- Ibid.
- “Annual Survey of State and Local Government Finances,” U.S. Census Bureau, September 7, 2017
- “Annual Survey of School System Finances (FY 2015),” U.S. Census Bureau, June 14, 2017.
- “Search for Public School Districts,” National Center for Education Statistics.
- “Annual Survey of School System Finances (FY 2015),” U.S. Census Bureau, June 14, 2017.
- “Virginia Cohort Reports,” Virginia Department of Education.
- Illinois Policy Institute calculations using Bureau of Economic Analysis Regional Data for GDP and Personal Income from 2000-2016
- “SOI Tax Stats – Migration Data,” Internal Revenue Service, November 30, 2017.
- Illinois Policy Institute calculations using Bureau of Economic Analysis Regional Data for GDP and Personal Income from 2000-2016
- Ibid.
- Ibid.
- Ibid.
- Ibid.
- Ibid.
- “2016 Property Tax Statistics Table 11”, Illinois Department of Revenue, 2018.
- Code of Virginia § 40.1-57.2
- Code of Virginia § 40.1-57.3
- Code of Virginia § 40.1-55
- Code of Virginia § 40.1-59, 40.1-62
- Mailee Smith, “Rigged: How Illinois’ labor laws stack the deck against taxpayers,” Illinois Policy Institute, Winter 2017.
- Orphe Divounguy, “Building fairness and opportunity: The effects of repealing Illinois’ prevailing wage law,” Illinois Policy, 2017.
- “Annual Survey of Public Pension Systems,” U.S. Census Bureau, 2015.
- Ibid.
- “Delivering Efficient, Effective, and Streamlined Government to Illinois Taxpayers,” Task Force on Local Government Consolidation and Unfunded Mandates, December 17, 2015.
- Gabrielle Fack and Julien Grenet, “When do better schools raise housing prices? Evidence from Paris public and private schools,” Journal of Public Economics, 2010.
- Sandra E. Black, “Do public schools matter? Parental valuation of elementary education,” Quarterly Journal of Economics, 1999.