Labor-union membership in Illinois: Public vs. private
Only 10 percent of private-sector workers in Illinois belong to a union. But over half of public-sector workers are unionized.
Illinois has a sizable labor-union participation rate – about 15 percent of wage and salary workers belong to a union. But too little is known about the composition of the labor-union community itself. What publicly available data that does exist does not delve into the demographics and incomes of these workers.
The Illinois Policy Institute commissioned a custom data search from Bloomberg BNA to shed light on the makeup of the labor community, using data from the U.S. Census Bureau’s Current Population Survey.
Even though approximately 1 in 12 wage and salary workers are union members in Illinois, union members dominate public-sector employment in the state. In the public sector, more than 52 percent of workers are members of a union and 54 percent are covered by one. In contrast, only 10 percent of private-sector workers are members of and covered by a union in Illinois.
In Illinois, the private sector employs about 4.7 million workers. Of this group, 457,000 workers are union members. In other words, about 1 in 10 workers who work in the private sector, which includes both for-profit and nonprofit firms, are union members.
About 741,000 Illinois workers are employed by government entities in Illinois. Of those employees, 384,000, or just over half, are members of a union.
Based on Illinois’ total employment by race and Hispanic ethnicity, the data revealed that whites make up 82 percent of workers in Illinois, but only 78 percent of private-union members.
Blacks make up 12 percent of private-sector workers in Illinois, but account for 17 percent of private-union members.
Asians make up 5 percent of private-sector workers, but only 3 percent of private-union members.
Hispanics account for 15 percent of private-sector workers and 14 percent of private-union members.
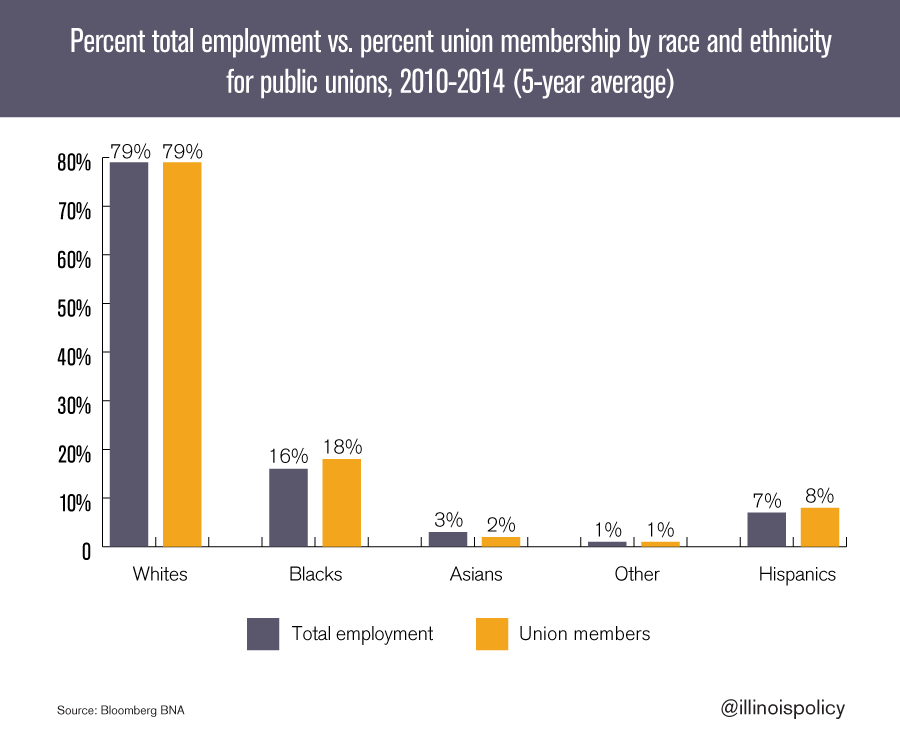
Whites make up 79 percent of public-sector workers and public-union members in Illinois.
Blacks make up 16 percent of public-sector workers in Illinois, but account for 18 percent of public-union members.
Asians make up 3 percent of public-sector workers and 2 percent of public-union members.
Hispanics account for 7 percent of public-sector workers and account for 8 percent of public union members.
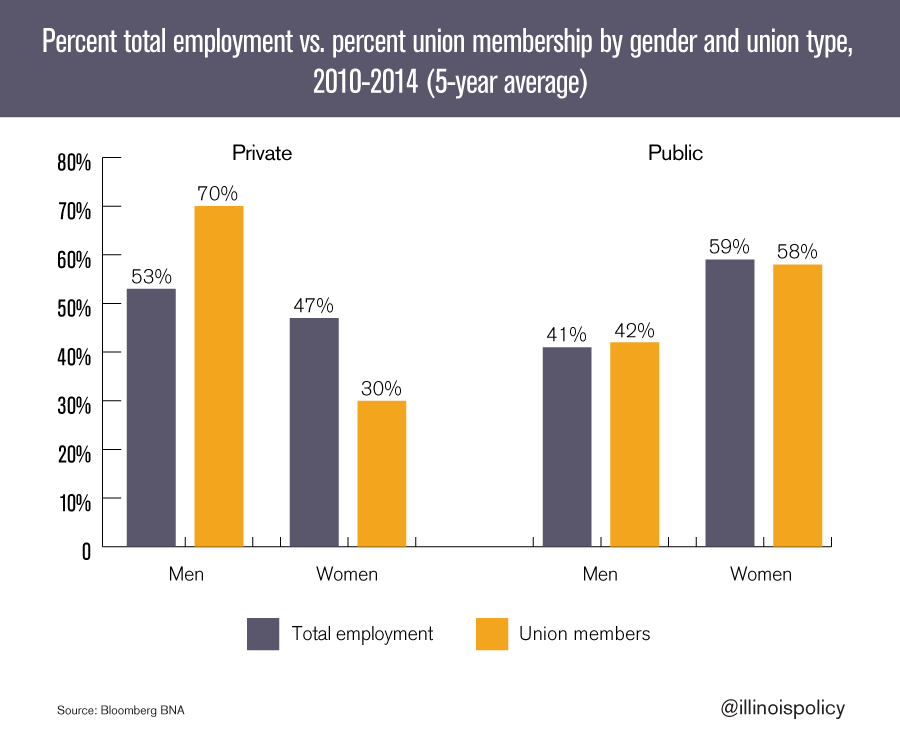
Illinois’ labor force is almost evenly split between men and women. But there is a wide variation between private- and public-union employment and membership.
In the private sector, men account for 53 percent of workers but 70 percent of union members. Women account for 47 percent of private-sector workers but 30 percent of union members.
In the public sector, men account for 41 percent of workers and 42 percent of public-union members. Women account for the majority of public-sector workers at 59 percent. They make up 58 percent of public-union members.
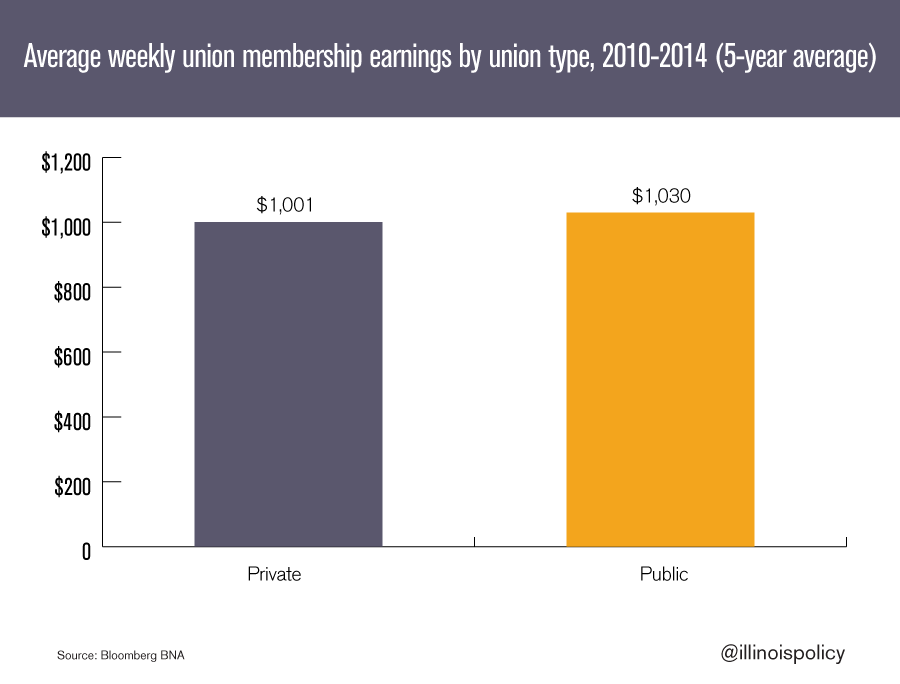
In Illinois, private-union members earn an average of $1,001 per week. Public-union members earn an average of $1,030 per week. But a deeper look into these averages reveals other pay disparities.
On average, female union members in Illinois’ private sector earn about one-third less than their male counterparts.
Despite being overrepresented in public-sector union membership, female public-union members earn 29 percent less than their male public-union colleagues. Male public-sector workers earn an average of $1,242 while women earn $879.
Image credit: Michelle Robinson


